Introduction
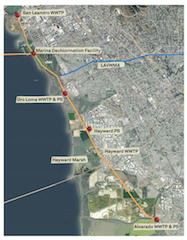
East Bay Dischargers Authority (EBDA) is a joint powers agency consisting of five local agencies including Oro Loma Sanitary District, Union Sanitary District, City of San Leandro, City of Hayward and the Castro Valley Sanitary District. EBDA conveys treated wastewater from its member agencies together with treated wastewater from Livermore-Amador Valley Water Management Agency (LAVWMA), which is comprised of treated wastewater from the City of Livermore and San Ramon Services District, to the Marina Dechlorination Facility (MDF) near the San Leandro Marina, as shown in Figure 1. EBDA treats and discharges on average 60 million gallons per day (MGD) of disinfected and dechlorinated secondary effluent to the San Francisco Bay.
Figure 1. EBDA Operations schematic
While the current disinfection system used by the EBDA wastewater facilities meets all regulatory requirements in accordance with its National Pollutant Discharge Elimination System (NPDES) permit, EBDA studied the feasibility of alternative disinfection methods to simplify operations, reduce costs and protect the environment from discharge of halogenated disinfection by-products. Sea level rise also threatens the resiliency and reliability of the dechlorination system located at MDF, increasing the urgency of identifying feasible alternatives to the current treatment operations. To verify the positive results of bench scale testing conducted on peracetic acid (PAA), which has previously been shown to have the benefit of reduced aquatic toxicity, lower costs, and simplified operations (Bell and Wylie, 2016; Bell and Block, 2015; Bell and Archer, 2013), EBDA conducted a 16-day full-scale trial to evaluate disinfection efficacy with respect to microbial limits in its NPDES permit.
EBDA is unique in that it dechlorinates secondary wastewater effluent from multiple agencies with various treatment processes, and must meet permit requirements at a common compliance point prior to discharge. Thus, there were challenges in implementation of this full-scale trial that are wide-ranging, however, results of the study do provide insight into potential benefits of the permanent use of PAA, and the challenges that must be addressed in implementation of this alternative technology for a complex transport system that discharges effluent from a variety of publicly owned treatment works (POTWs).
Peracetic Acid
PAA is an organic acid that is widely used for wastewater disinfection in Europe, and at dozens of POTWs in the United States. The largest PAA disinfection system in the world was started up at the Metropolitan Wastewater Reclamation District’s Robert W. Hite Treatment Facility on January 2018 in Denver, Colorado; the facility initiated PAA disinfection for up to 220 MGD of effluent at peak flow after demonstrating that PAA had the same virus efficacy as their previous chlorine disinfection system (Dunkin et al., 2017). PAA is manufactured by combining acetic acid with hydrogen peroxide in the presence of a catalyst, typically sulfuric acid. Use of PAA for wastewater disinfection may result in several potential benefits, including a shelf-life (up to one year) and high oxidation potential (Bell and Stewart, 2014). Because PAA does not contain chlorine, halogenated disinfection byproducts are not created when dosing with PAA, and this chemical does not produce a chlorine residual, which may benefit POTWs whose discharge permits limit total residual chlorine at the compliance point.
There are at least five US Environmental Protection Agency approved products for wastewater disinfection (Table 1), and with the interest in PAA this list is growing. For this study, the 22% Enviro Tech solution was selected because of lower unit cost for PAA. While PAA has advanced from being considered an innovative technology to an emerging technology for wastewater disinfection in the US, additional evaluation may be needed to support NPDES permitting (Wylie et al, 2016).
Table 1. EPA Approved PAA products for wastewater disinfection
| Proxitane WW-12 | Peraclean 15* | VigorOx WWT II | SaniDate 15* | Peragreen WW | Peragreen 22WW | ||
| Chemical Composition | |||||||
| Peracetic acid | 12% | 15% | 15% | 15% | 14.8-15.7% | 21.5% | |
| Hydrogen peroxide | 18.5% | 22% | 23% | 10% | 21.5-22.5% | 5% | |
| Acetic acid | 20% | 15-20% | 16% | 40% | 15.8-16.6% | 40-50% | |
| Water | Bal | Bal | 45% | 35% | Bal | Bal | |
| *Label not for use in California
Bal = Balance |
|||||||
Study Background
EBDA initially partnered with Enviro Tech Chemical Services (Enviro Tech), a manufacturer of two approved products for wastewater disinfection, to conduct bench testing at locations of individual partner agencies in the EBDA. The goal of the bench testing was to evaluate PAA efficacy with respect to bacteria criteria in its discharge permit, and to identify an appropriate location for a potential full-scale trial.
For bench testing, member agency effluent samples were collected from five locations and analyzed for initial fecal coliform and Enterococci1 concentrations. Samples were dosed with Peragreen 22WW, in duplicate for target contact times of 20 minutes and 40 minutes with either 2 milligrams per liter (mg/L) or 4 mg/L of PAA. Disinfected samples were collected at 20 minutes contact time, dosed with erythorbic acid to quench PAA residual, and were immediately analyzed for fecal coliforms and Enterococci. This procedure was repeated for samples at 40 minutes contact time.
Results for fecal coliform showed that initial (untreated) concentrations of fecal coliform ranged from 500 to over 240,000 colony forming units per 100 milliliter (CFU/100mL). Samples disinfected with 4 mg/L PAA resulted in fecal coliform counts of less than 100 CFU/100mL at both 20 and 40 minutes of contact time. At 2 mg/L PAA, and initial fecal coliform concentrations greater than 240,000 CFU/100 mL), fecal coliform concentrations exceeded EBDA’s permit limits, regardless of contact time. For Enterococci, initial concentrations ranged from 500 to over 240,000 CFU/100 mL. All samples disinfected with 4 mg/L PAA resulted in Enterococci concentrations <100 CFU/100 mL at both 20 and 40 minutes of contact time. However, at 2 mg/L PAA and 20 minutes of contact time, Enterococci counts exceeded EBDA’s permitted value of 242 CFU/100 mL in two samples. For all tests, the initial PAA demand ranged from 0.5 to 1.25 mg/L, depending on sample location.
Full-Scale Demonstration Testing
Based on results of bench tests, EBDA and Enviro Tech began planning for a full-scale trial, with an anticipated a target PAA dose between 2 mg/L and 4 mg/L of the 22% solution. Primary objectives of the full-scale trial included identification of effective PAA doses at full-scale for influent operating conditions, and the effects of PAA on aquatic toxicity results compared to sodium hypochlorite disinfection and dechlorination. Tracer testing was conducted by Enviro Tech and EBDA to determine the contact time available at various flows. The tracer testing was used to establish hydraulic retention times between P1 (PAA injection point) and the downstream sampling locations, which also showed that there was approximately a maximum of 40 minutes contact times at peak flows.
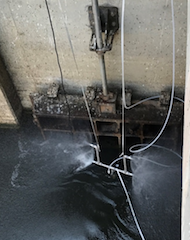 Figure 2. PAA injection manifold, typically submerged, shown above water to demonstrate dispersion path of injection PAA solution.
Test Plan
To implement the full-scale trial, without impacting compliance or operations of the MDF, the demonstration was conducted in a portion of EBDA’s system. The Oro Loma Effluent Pump Station (OLEPS), where EBDA currently collects and pumps secondary effluent from three partners was selected for PAA dosing. For inclusion of this data in the WE&RF LIFT 14T16 project, Stantec reviewed test protocols and provided review of data from the full-scale trial. PAA dosing was applied at P1 (Figure 2), and samples were collected and the following locations (Figure 3):

Figure 3
The test plan included initial PAA dosing at 4 mg/L, with step-wise reduction of the dose to identify the lowest effective dose for which permit requirements for bacteria would be met. The test protocol also included sampling and monitoring for pH, PAA residual, and carbonaceous biochemical oxygen demand (cBOD5). A CarboVis®, reagentless, optical-based spectrophotometer built into a field probe, was installed during the second half of the trial to evaluate the potential use of the instrument for online process monitoring and process control with chemical oxygen demand (COD) and ultraviolet transmittance (UVT), which have been shown to be useful at other sites (Block et al., 2015).
Full-Scale Trial Operation and Test Plan Modifications
EBDA and Enviro Tech initiated the trial at 4 mg/L of PAA and maintained the dose for four days. According to the test plan, the dose was dropped to 3.5 mg/L after four days; however, shortly after the dose was reduced, observations of unusual solids were visible entering the OLEPS wetwell. The occurrence of this event was eventually determined to be a process upset upstream of OLEPS, not related to the PAA trial. Because of concerns about the upstream process upset and potential increases in PAA demand, the PAA dose was increased back to 4 mg/L.
Due to the unusual conditions in the system during the trial, the operations plan was refocused to allow EBDA to maintain permit compliance with dose optimization being a secondary objective. PAA residuals during this period were lower than anticipated at P2, P3 and P4 at the 4 mg/L, concurrent with elevated fecal coliform and Enterococci counts.
In addition to the upstream process issues resulting in high solids, another partner agency initiated construction upstream of the OLEPS during the trial. Upon notification of the construction activities, the PAA dose was increased to 6 mg/L for the remainder of the trial. To address the additional oxidant demand observed at the end of the trial period, hydrogen peroxide was added to P0 at a dose of 6 mg/L, prior to PAA dosing. This practice has been successfully applied for other industries to address excess PAA demand during process upsets (Enviro Tech, unpublished data). A summary of PAA dosing is presented in Table 2.
Table 2. Trial dosing and activities
| PAA Dose | Notes | |
| 7-Sep | 4 mg/L | |
| 8-Sep | 4 mg/L | Upstream process upset |
| 9-Sep | 4 mg/L | Upstream process upset |
| 11-Sep | 3.5 mg/L | Upstream process upset |
| 12-Sep | 3.5 mg/L | Upstream construction |
| 13-Sep | 3.5 mg/L | Upstream construction |
| 14-Sep | 4 mg/L | Upstream construction |
| 15-Sep | 4 mg/L | Upstream construction |
| 16-Sep | 6 mg/L | Upstream construction |
| 17-Sep | 6 mg/L | |
| 18-Sep | 6 mg/L | Upstream construction |
| 19-Sep | 6 mg/L* | Upstream construction |
| 20-Sep | 6 mg/L* | Upstream construction |
| 21-Sep | 6 mg/L* | Upstream construction |
| *6 mg/L of hydrogen peroxide was added upstream of PAA dose.
Key: PAA = Peracetic acid mg/L = milligrams per liter |
||
Full-Scale Trial Results
Despite these operational challenges, EBDA remained in compliance with all permit requirements during the full-scale trial. As described, the initial PAA demand was higher than anticipated based on bench test data, and was attributed to the upstream process upset and upstream construction activities at facilities providing influent to OLEPS.
PAA Dose and Residuals
The PAA dose and residuals at all sample locations are presented in Figure 4. Using the calculated contact times, as extrapolated from the results of EBDA’s and Enviro Tech’s tracer tests, PAA residuals were also plotted as a function of estimated contact time (Figure 5).
Figure 4. PAA dose and residual at all sampling locations throughout the EBDA trial
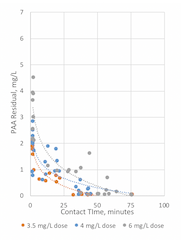
Figure 5
Figure 5. PAA dose and residual at various contact times.
As previously noted, during the last three days of the trial, Enviro Tech dosed hydrogen peroxide at point P0, to address the excess PAA demand resulting from the unusual upstream activities. As illustrated in Figure 4, measured PAA residuals at P2 and P3 were noticeably higher following addition of hydrogen peroxide; this supported the anecdotal reports that hydrogen peroxide was oxidizing some of the excess reduced compounds (e.g., organics, metals, sulfides). Further, as anticipated, measured PAA residuals were generally observed to be higher at locations for higher doses, when contact times were similar at those locations.
Bacterial Inactivation Results
Some of the bacteria monitoring data were inconclusive because of unanticipated “too numerous to count” (TNTC) results. Initially, the contract laboratory did not perform dilutions; and, because of the lag in obtaining data, it was not possible to rerun samples past their hold times. Thus, results for fecal coliforms at all monitoring points were TNTC for the first four days of the trial, but were available for the remainder of the trial, with exception of a few samples at various locations. Similarly, analyses for Enterococci at all trial monitoring points were too high to count (>2419) for the first four days of the trial. Additionally, all Enterococci concentrations at P0 (control, prior to PAA addition) and P2 (approximately 2 minutes) throughout the trial were too high to count (>2419). There were further data issues for P3 or P4 throughout the trial, however, the exact cause of the issues has not be resolved. While the data inconsistencies at points P3 and P4 could not entirely be attributed to errors in dilution; there may also be false positives from use of the IDEXX method particularly for marine influenced samples, as previously reported (Ferguson et al., 2013; McDonald et al., 2003). Because of the lack of resolution in the Enterococci data, PAA efficacy for Enterococci cannot be evaluated for this application. Only fecal coliform results are presented; results over the duration of the trial are shown in Figures 6 and 7, as time series and as a function of contact time, respectively.
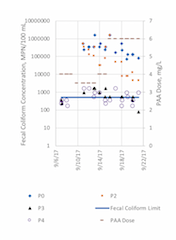
Figure 6. PAA dose, and fecal coliform concentrations at locations monitored in the EBDA PAA trial
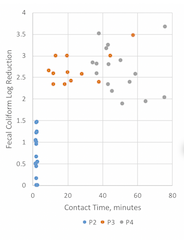
Figure 7. PAA dose and fecal coliform concentrations at various contact times.
Initial fecal coliform concentrations measured at P0 varied widely throughout the trial, from 70,000 MPN/100 mL to over 1.6 million MPN/100 mL. At P2, with an average contact time of 2 minutes, the log reduction of fecal coliforms ranged from 0 to 1.46; and at P4, upstream of additional flow contribution from another partner agency, log reductions were observed ranging from 1.88 to 3.66. However, contact times of 35 minutes or longer were required to reduce to fecal coliform concentrations below the permit limit of 500 MPN/ 100 mL under the conditions tested.
Longer contact time did not always result in increased reduction of fecal coliform, suggesting that the majority of fecal coliform reduction occurs within the first minutes of contact; however, there are a number of confounding factors that do not allow a clear statistical analysis of the data. For at least two samples, the fecal coliform value at P4 exceeded the value at P3. Another partner agency inflow is added between P3 and P4; however, there was no flow from that agency during these two events, and without additional data, it cannot be determined whether this is a result of analytical variation or other cause.
As shown in Figure 6, fecal coliform counts at P4 (upstream of EBDA’s compliance point) hovered around the permit limit of 500 MPN/100 mL. It is important to note that this varied from the data collected at the compliance point, which included flow contributions from another partner agency just downstream of P4; calculation of the geomean of the compliance point data met permit requirements as shown in Figure 8. The higher values at P4 compared to the reported permit values suggest further study and evaluation is needed to understand the contradiction in these data sets. While there are many potential reasons for these data conflicts (sampling and/or lab analysis errors at P4, dilution from the partner agency between P4 and the compliance point, etc.), it is not possible to determine the cause of such differences with the information available.
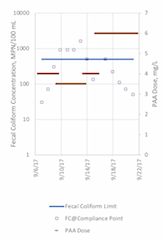
Figure 8. Fecal Coliform Concentrations at EBDA’s Compliance Point
EBDA conducted toxicity testing as part of its ongoing monitoring at their NPDES compliance point that receives flow from two other upstream locations that account for approximately one-third of the flow of the volume treated with PAA. Because of this, toxicity testing results cannot be attributed in whole to the peracetic acid dosing; however, results can be compared to EBDA’s typical chronic toxicity testing results using Fathead Minnows that yield a Chronic toxicity Unit (TUc) result of 2 as compared to a permit action limit of a TUc of 20. Chronic toxicity during the PAA pilot was determined to yield a TUc of 1.0, which is equal to or better than historic toxicity testing results at this facility.
Summary and Conclusions
In summary, the PAA demand from the combined secondary effluent at OLEPS was higher than anticipated based on the bench testing. And, PAA demands, as observed at P2, was up to 3.8 mg/L, depending upon the initial dose as well as the upstream operating conditions. The highest PAA demands were attributed to increased loadings from an upstream process system upset, and from construction activities at facilities contributing flow to OLEPS. However, even with these challenges, EBDA maintained permit compliance for fecal coliform and Enterococci during the trial with PAA dosing. At contact times longer than 10 minutes, little additional fecal coliform reduction was observed, suggesting that the majority of fecal coliform reduction occurs within the first few minutes of contact. This result is consistent with the short contact times that have been used at the Gulf Coast Authority Washburn Tunnel Facility in Pasadena, Texas (Levine et al., 2017) which was designed to provide disinfection in 7.5 minutes contact time at peak flow. However, contact times of 35 minutes or longer were required to reduce to fecal coliform concentrations below the permit limit of 500 MPN/ 100 mL.
The addition of hydrogen peroxide to address excess PAA demand during upstream system upsets was a novel approach, and may be considered for further study as a tool to handle operational disruption. This may also indicate that use of an alternative solution with a higher percentage of hydrogen peroxide could provide operational flexibility in that it could provide oxidation of some compounds that would otherwise consume PAA.
Based on the results of this study, PAA was effective in providing fecal coliform compliance, even during periods of system upsets and poor effluent quality; however, an optimized dose was not identified during this trial. While further study would be required to fully evaluate PAA efficacy, dose ranges, and economics with respect to Enterococci compliance, it is anticipated that PAA could serve as a cost effective alternative to sodium hypochlorite and sodium bisulfite, particularly since it has been implemented for Enterococci compliance at other facilities (Levine et al., 2017). Other lessons learned include the need to provide additional coordination with partner agencies to minimize disruption to operating conditions.
While toxicity data cannot be attributed in whole to PAA addition, the result of 1 TUc exceeded EBDA’s typical value of 2 TUc when disinfecting with chlorine, suggesting improved toxicity results with the addition of PAA.
In conclusion, PAA may be a cost-effective solution for EBDA and its partner agencies to eliminate the risks associated with total residual chlorine discharges, but additional evaluation should be conducted using a membrane filtration method for Enterococci to ensure that permit compliance will be met.
References
Edyta, S.-U.; Atwater, A., Cowan, K.; Van Anderson, B., McQuarrie, J., Bell, K. da Silva, A. (2017) Evaluation of Peracetic Acid as an Alternative to Chloramine for Effluent Disinfection at the Robert W.Hite Treatment Facility – Part I WEF Technical Exhibition and Conference, Chicago, IL.
Bell, K.Y. and Wylie, V. (2016). The Age of Peracetic Acid – A Solution to Increasingly Challenging Regulations, WaterOnline, January: 16 – 18.
Bell, K.Y. and Block, P. (2015). Peracetic Acid (PAA) Disinfection – Upgrading Wastewater Treatment Facilities to Reduce Ecosystem Toxicity. WEF Technical Exhibition and Conference, Chicago, IL.
Bell, K. and Stewart, S. (2014), Engineering Design Considerations for PAA Disinfection of Wastewater, WATERCON, Springfield, IL.
Bell, K.Y. and Archer, T. (2013). PAA – An alternative for wastewater disinfection: engineering and cost considerations, WEF Technical Exhibition and Conference, Chicago, IL.
Block, P., Morgan, S., Bell, K. and Stewart, S. (2015). Control Strategies for PAA Wastewater Disinfection Process with Variable Effluent Quality. WEF Technical Exhibition and Conference, Chicago, IL.
Dunkin, N., Weng, S.-C., N. Schwab, K.J., McQuarrie, J. Bell, K. Jacangelo, J.G. (2017). Comparative Inactivation of Murine Norovirus and MS2 Bacteriophage by Peracetic Acid and Monochloramine in Municipal Secondary Wastewater Effluent, Environmental Science and Technology, 51(5):2972-2981.
Ferguson, D.M., Griffith, J.F., McGee, C.D., Weisberg, S.B., and Hagedorn, C. (2013). Comparison of Enterococcus Species Diversity in Marine Water and Wastewater Using Enterolert and EPA Method 16004. Journal of Environmental and Public Health, Article ID 848049, 6 pages.
Levine, L., Hennagir, C., MacDougall, J., Stewart, S., Eaton, A. (2017). Peracetic Acid Disinfection for Industrial Wastewater Treatment – Washburn Tunnel Case Study, Proceedings of the Water Environment Federation, WEFTEC 2017: Session 301 through Session 309, pp. 1490-1499.
McDonald, J., J. Nelson, C. Belcher, K. Gates, and K. Austin. (2003). Georgia estuarine and littoral sampling study to investigate the relationship among three analytical methods used to determine the numbers of enterococci in coastal waters. Georgia Department of Natural Resources Report.
Wylie, V., Charnas, C., Bell, K.Y., da Silva, A.K., Jacangelo, J., Funk, D., and Block, P. (2016). Peracetic Acid Addresses Increasingly Challenging Regulations – What Else is Needed for Implementation? WEFTEC, New Orleans, LA.